Peter Bak, PhD, Visual Data Scientist at K Health
Holli Hill, DO, Practicing ER Physician and Director of Clinical Affairs and Quality Assurance at K Health
Zehavi Kugler, MD, Practicing Primary Care Physician and VP of Medical Sciences at K Health
In a white paper published last month, we share how K Health’s Data Science and Medical Quality Assurance Team built a first-of-its-kind tracking platform designed to help clinicians make the right treatment decisions, at the right time.
We’re different types of doctors who work together at K Health to address major quality control issues in healthcare. We recently published a white paper to share the results of our new intervention program using K Visual Analysis, an innovative quality tracking platform that visualizes data to show how the decisions of our 100+ clinicians compare to their colleagues and clinical guidelines. You can download it here.
Our team started with reducing medically unnecessary prescriptions, but our goals are much bigger than that.
Visualizing Data to Empower Clinicians to Continue Improving
My role in K Health is to visualize medical information in ways that help doctors make better decisions and improve their patients’ well being. I’ve always been interested in using visualization as a means for data analysis and an interface between the expert and data, in order to shorten the time to get useful and actionable information at the right time and in the right context.
Information visualization is a challenging yet rewarding field within data science. It requires skills from a variety of people and expertise, such as statistics, cognitive psychology, and creative design.
When the team started working on K Visual Analysis, the goal was to be able to offer clinicians on our platform real-time second opinions, based on the clinical guidelines and what their colleagues were doing so they could make better, more informed decisions with their patients.
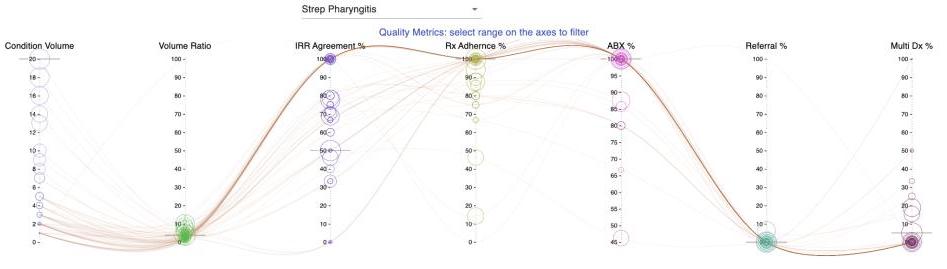
Since many people are visual thinkers, and sometimes seeing is more effective than reading, we were able to take data from previous patient encounters, including medical charts, conversations, and treatment decisions, and show clinicians the treatment decisions of providers have done with similar patients.
K Visual Analysis is beneficial for both clinicians and the leaders at K Health whose goal is to make sure all our users are getting the highest quality of care. Our Medical Quality Assurance Team can keep tabs on how providers are prescribing, compared to clinical guidelines and typical behaviors, and intervene on the spot to ensure patients are getting the right care, at the right time.
We built this platform with our six million users in mind. To the best of our knowledge, in-person providers and other telehealth companies don’t have anything as comprehensive and effective to track their quality of care, and transform it into actionable insights
– Peter Bak, PhD, Visual Data Scientist at K Health
Built-In Second Opinions to Increase the Quality of Our Care
As a practicing ER doctor, I’ve always been baffled about the lack of personalized quality control and clinical feedback in the places I’ve worked. Sure we have reminders via our EMR systems of what to do in certain situations, and are forwarded the latest CDC guidelines on how and when to do certain tests or procedures, but nothing is ever personalized to the situation or shared in real-time. Decisions are also not formally monitored to make sure they are correct. For example, eventhough hospital departments do monitor sepsis measures, there’s still no mechanism to give feedback on the individual clinician level.
There are so many instances when providers are working a mile and minute and could use another set of eyes—which often no one has time to give. Even for something as simple as whether a sore throat is caused by an infection or virus could help doctors from prescribing something that a patient may not need.
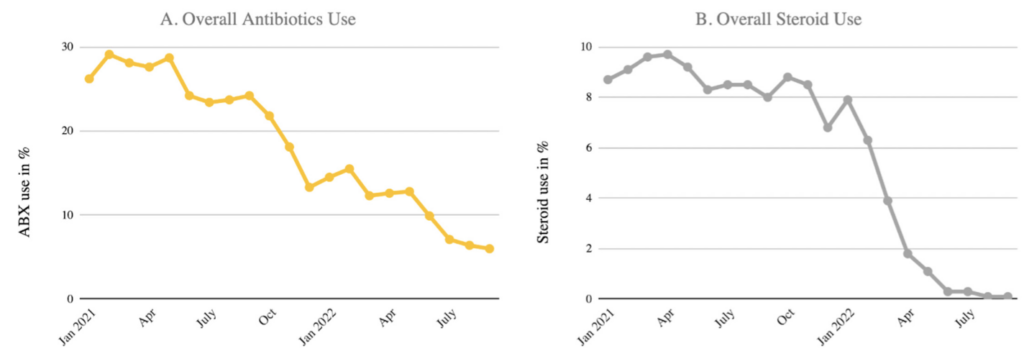
When we noticed that the rate of unnecessary antibiotic and steroid prescriptions on our platform were over industry average, we began to build a way to intervene with our providers in real-time to make sure they make the correct prescribing decisions, and also give them feedback–which is rarely done in the hospital setting.
An example? A clinician on my team often defaulted to prescribing antibiotics for a variety of conditions and symptoms, not just bacterial infections. By being able to see with their own eyes how their colleagues would treat similar cases, and with real-time feedback from people on my team, they were able to considerably improve how and when they prescribed antibiotics. They decreased their inappropriate prescribing from ~30% to 5%.
– Holli Hill, DO, Practicing ER Physician and Director of Clinical Affairs and Quality Assurance at K Health
Reducing Unnecessary Prescriptions Is Only the Beginning
The results thus far have been tremendous. Unnecessary prescribing of antibiotics for viral infections on our platform are now well below the national average. This has never been accomplished in other antibiotic stewardship programs. The same goes for steroids.
With the power of AI and visual analysis, our team at K Health has built something that’s never been built before for the healthcare setting. Not only does this platform help make sure our patients get the best care, it also helps keep us on our toes, and get better at our jobs.
– Zehavi Kugler, MD, Practicing Primary Care Physician and VP of Medical Sciences at K Health
Download Innovative Quality Tracking Platform Promotes Proper Prescribing of Antibiotics and Steroids Through Targeted Interventions Today!
K Health articles are all written and reviewed by MDs, PhDs, NPs, or PharmDs and are for informational purposes only. This information does not constitute and should not be relied on for professional medical advice. Always talk to your doctor about the risks and benefits of any treatment.